Uncategorized
What does chart analysis mean?

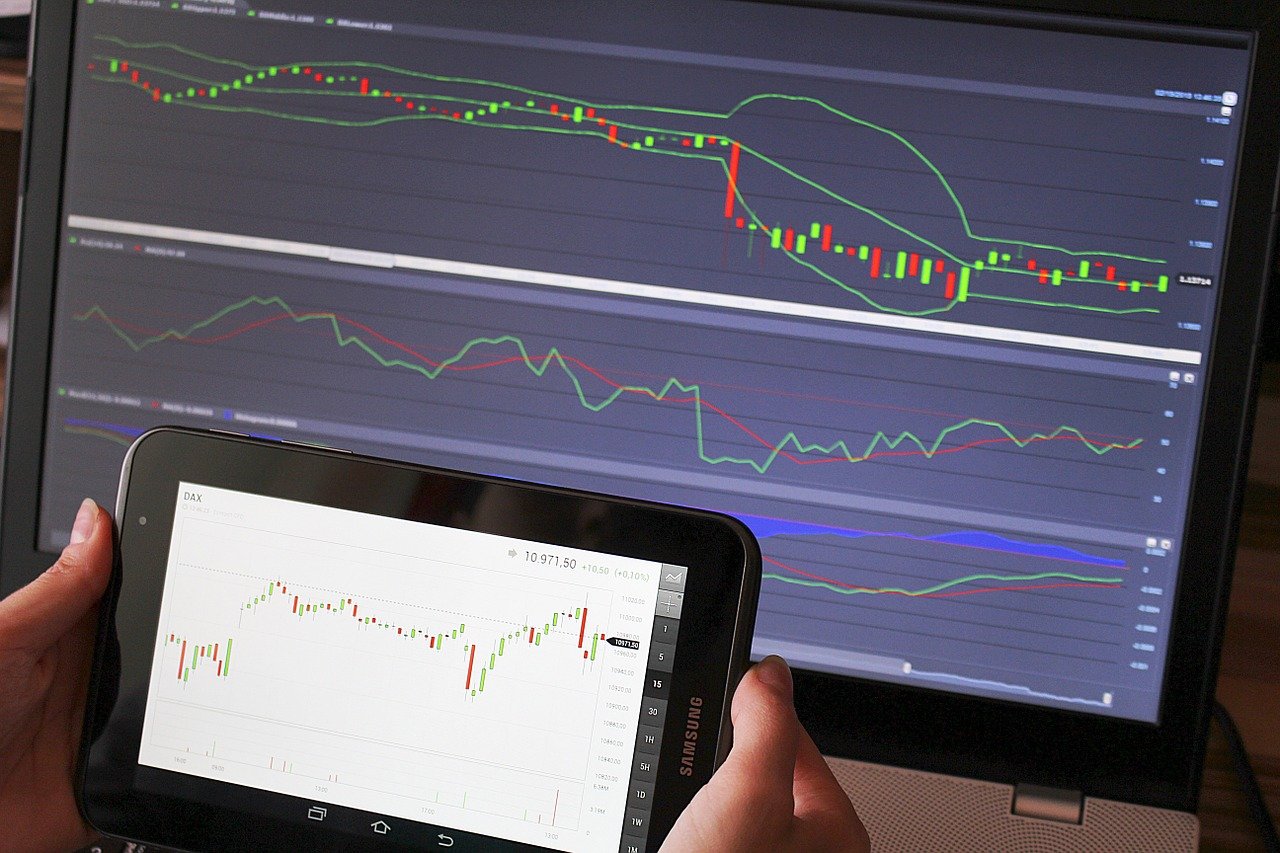
Most brokers always emphasize the importance of charts. This is mainly due to the fact that although foreign exchange is subject to many influences, they can be easily foreseen and graphically displayed.
In addition, the foreign exchange market is subject to an immense demand for transactions, after all, money is always needed. In order to be able to read rates well and possibly even estimate rate developments for the near future, it needs charts. The chart form and the scaling determine how well they can be read.
Since the reading of charts can quickly overwhelm some beginners, it is advisable to start with a simple chart form such as a bar chart with linear scaling. Not only the structure of the chart plays a role, but also the scaling. It indicates how the individual developments of the currency in the observation period are integrated into the chart. Meanwhile, two different scalings have become established: The linear and logarithmic. Linear stands for a continuous or constant development. The individual steps, which the course covers, always remain the same and are always transferred in the same distance into the Chart.
Chart analysis?
From the analysis of a chart some important information can be read. Important terms here include support and resistance levels. Both denote price levels at which buyers or sellers have entered the market in such a quantity that the price has changed or stopped.
If we see a chart with a constant wave movement, the support and resistance levels can often be drawn horizontally. This makes it easy to see where buyers or sellers are likely to re-enter the market. The resistance level is usually drawn at the top. This is where, for example, a rising price “bounces” off the resistance and falls again. The support or support level is drawn at the bottom of the chart. A falling price movement receives support from buyers again from this level and can reverse its trend.
- It is very easy to draw levels using the principle of swing highs and swing lows. They denote the highest and lowest points of a price within a certain price movement.
- Many prices move in waves; swing highs are then each highest point of a wave, the counterpart of swing lows.
- However, even strong uptrends, possibly not by a wave, but a strong rising line, can have swing highs and lows. With a little practice, you can often spot several of these points at once.
- Resistance level, support level, swing highs and lows are good analysis tools, for example to plan one’s further strategy or to set stop loss marks. In any case, they should be included in a strategy if you want to look deeper into the market.
Linear scaling in trading
The linear scaling is suitable for many scenarios, but more and more often charts have to be viewed in a more differentiated way. Logarithmic scaling is used for this purpose. Here the development is not constant, but is oriented to a certain fixed point. If, for example, the course of a price suddenly rises sharply during the observation period, a line is drawn from the fixed point.
Now the price continues to rise in the same proportion. With the linear scaling one would draw now still another, equally long line, in order to make this further rise recognizable. In the logarithmic scaling, however, one draws it smaller than the first one, because the price continues to rise in the same ratio, so actually shows no significant increase.
Candlestick charts are important
From a certain time you should start to deal with candlestick charts. They require a little more time to learn than a simple bar chart, but they are used by professionals all over the world.

